
These days, the success of a mobile app isn’t just measured by how many people download it. A user might install an app, open it once, and never come back. That’s why tracking mobile app performance metrics has become essential for businesses, developers, and creators alike.
Understanding what drives engagement, retention, and revenue can mean the difference between an app that thrives and one that quietly fades away.
In this post, we’ll break down the most important mobile app performance metrics you should track and explain why they matter.
What Are Mobile App Performance Metrics and Why They Matter
Mobile app performance metrics are the numbers that reveal how well your app is doing. They aren’t just statistics. They tell a story about your users, their behaviors, and how your app fits into their daily lives.
For example, if you find that you have a high amount of time spent in the app, but low app downloads, this tells you that people enjoy using the app, but not enough know about it.
On the flip side, low time spent in the app with favorable download counts would tell you that people know where to find the app, but that it may not have enough content to keep them engaged for very long.
Ultimately, metrics help you identify what’s working, what isn’t, and where to invest your time and resources.
Key Mobile App Performance Metrics
include a formula or benchmark ranges for each metric.
1. Installs / Downloads
Installs measure how many times your app has been downloaded and added to users’ devices. It’s a clear indicator of your app’s reach and initial appeal.
For example, a strong marketing campaign may drive high downloads, but if users never open the app, these numbers don’t tell the full story.

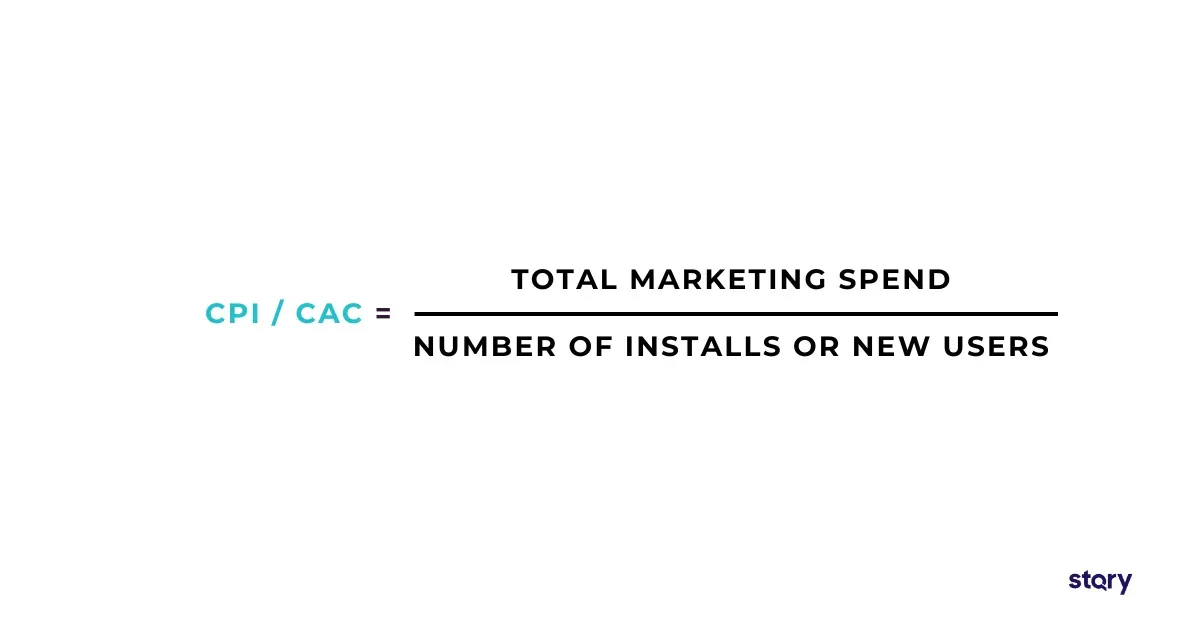
2. Cost per Install (CPI) / Customer Acquisition Cost (CAC)
CPI or CAC tracks how much it costs to acquire each new user. It helps you understand if your marketing spend is delivering real value.
For instance, spending $10 per install may be fine if users stay active and make purchases, but it’s wasteful if they uninstall immediately.
3. Daily Active Users (DAU) / Monthly Active Users (MAU)
Daily Active User (DAU) and Monthly Active User (MAU) show how many unique users engage with your app daily or monthly. They reveal engagement trends and whether users find your app compelling enough to return regularly.
If your DAU/MAU ratio is high, it signals strong user loyalty.
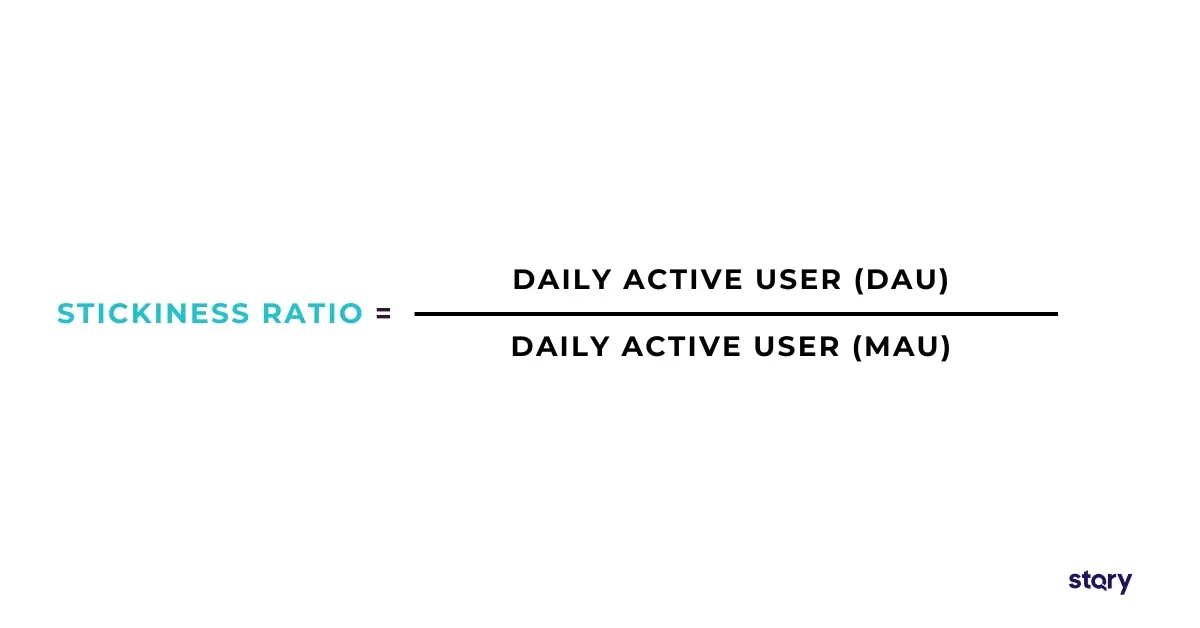
4. Stickiness Ratio (DAU / MAU)
The stickiness ratio compares daily and monthly active users, showing how often users return. A high ratio means users frequently engage, which is a good sign of retention.
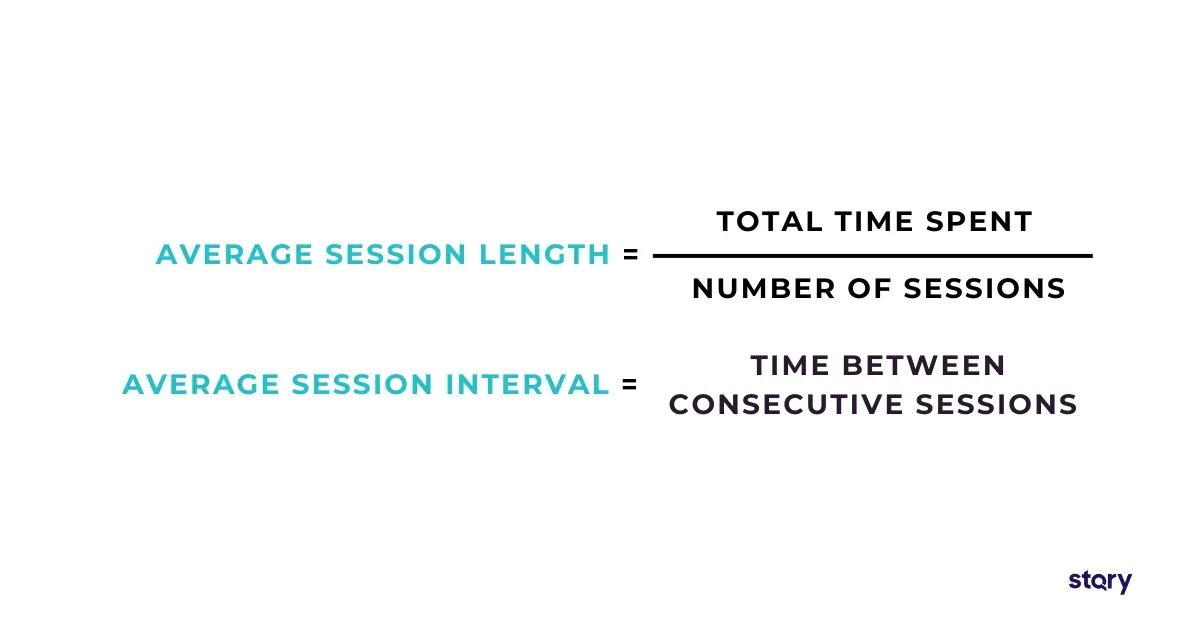
5. Session Length and Interval
Session length measures the time a user spends in your app per visit, while session interval tracks how long they wait between sessions.
Longer sessions and shorter intervals generally indicate that users find value in your app and keep coming back.
6. Screen Views Per Session
This metric counts how many screens a user visits during a single session. More screen views suggest deeper engagement, while fewer views may indicate navigation or usability issues.
For example, a game app may aim for multiple level screens per session, whereas a utility app may need fewer screens.

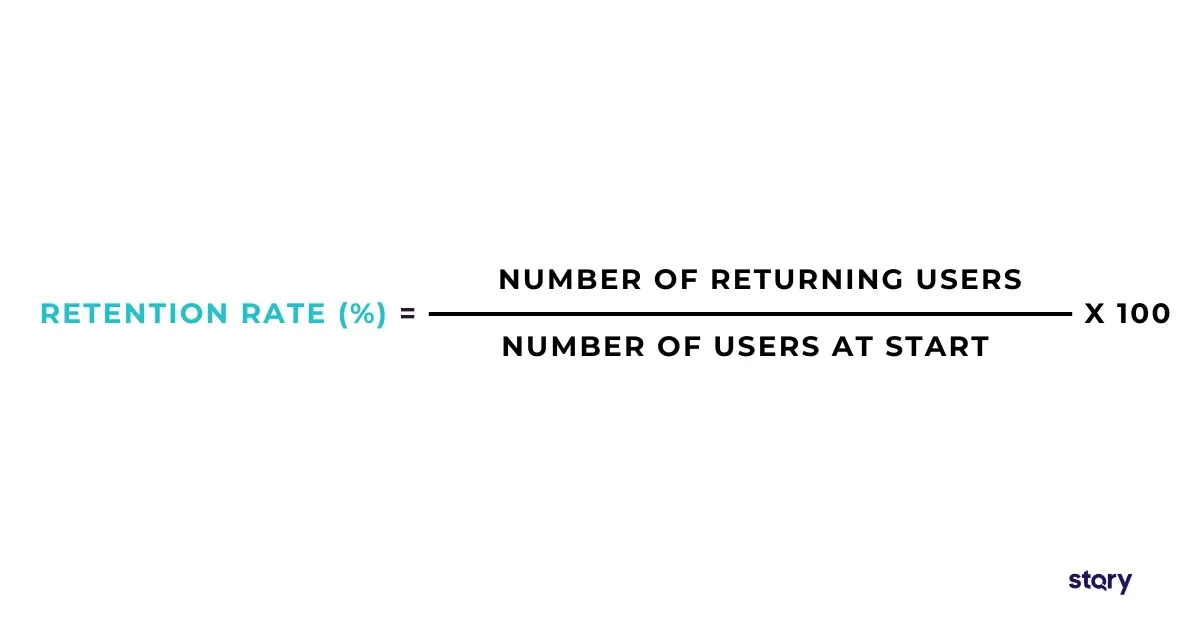
7. Retention Rate
Retention rate measures the percentage of users who continue using your app after a specific period.
Tracking Day 1, 7, and 30 retention helps you identify how well your app keeps users over time. High retention rates indicate a valuable and engaging app.
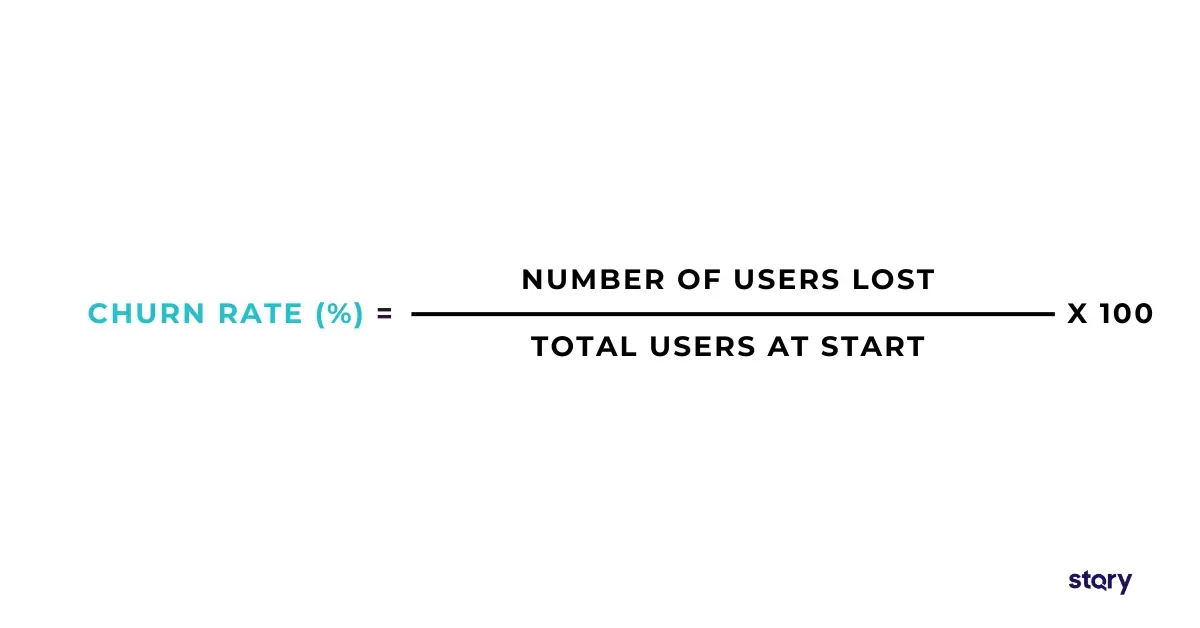
8. Churn Rate / Uninstall Rate
Churn rate shows the percentage of users who stop using your app or uninstall it. High churn is a warning sign that your app may have engagement, usability, or satisfaction issues.
Keeping churn low ensures a stable and loyal user base.
9. App Startup Time (Cold, Warm, Hot)
Startup time measures how long your app takes to load from various states—cold (completely closed), warm (running in background), and hot (recently active).
Faster startup times create a better user experience and reduce frustration.
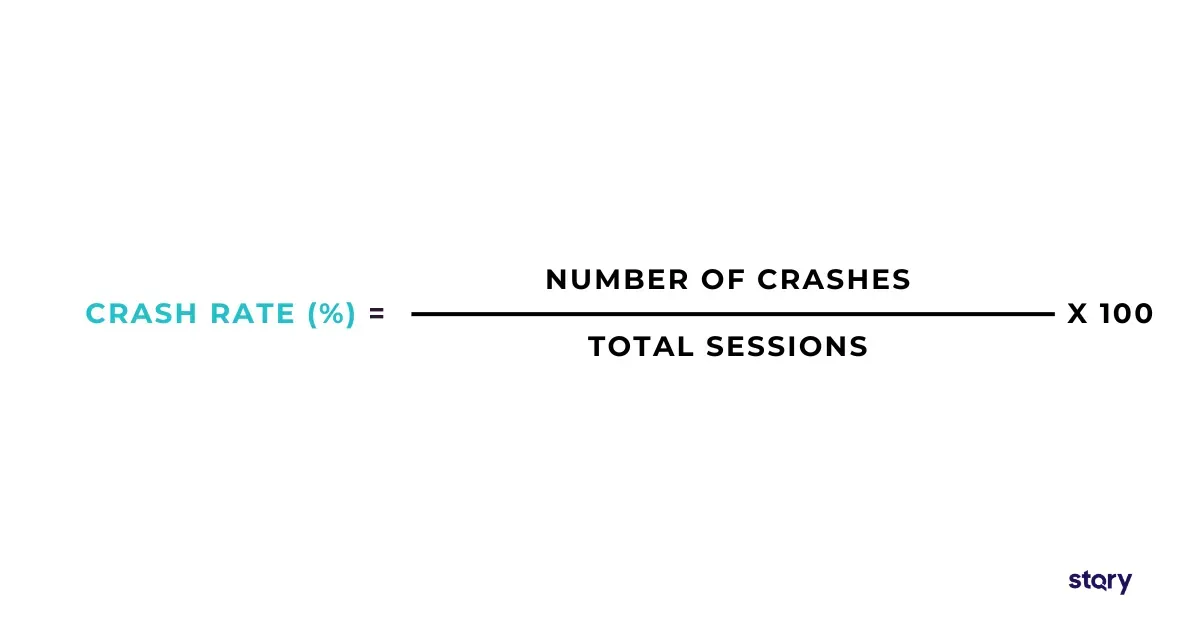
10. Crash Rate / Error rate
Crash rate tracks how often your app unexpectedly closes or encounters errors. High crash rates hurt user trust and retention. Monitoring and reducing crashes improves app reliability and satisfaction.
11. Latency / UI Responsiveness
Latency measures how quickly your app responds to user inputs. Low latency and smooth responsiveness ensure users can navigate seamlessly. Apps that lag or freeze can quickly lose their audience.
12. Average Revenue Per User (ARPU)
ARPU calculates the average revenue generated per user. It helps you assess monetization effectiveness, whether through subscriptions, ads, or in-app purchases. High ARPU means each user contributes more value to your business.
13. Lifetime Value (LTV)
LTV estimates the total revenue a user will generate over their engagement with your app. It’s essential for understanding long-term value and planning growth strategies. A high LTV indicates users remain active and spend over time.
14. In‑app Purchases and Subscriptions
This metric tracks revenue generated from in-app transactions. It shows how effectively your app converts users into paying customers and helps optimize pricing strategies and content.
How to Measure and Monitor Mobile App Performance Metrics
Tracking metrics is only the first step. What truly matters is how you measure, interpret, and act on them. Here are some tips to help you get the most out of your app analytics.
1. Set Up Your Analytics Infrastructure
Before you can make sense of your metrics, you need a solid analytics foundation. Choose tools that capture key performance indicators like user sessions, retention, in-app purchases, and engagement patterns.
With the right setup, you can easily collect accurate data across all platforms and devices without complex manual tracking.
2. Monitor and Visualize Data
Dashboards let you quickly monitor trends, visualize patterns, and spot issues in real time, so you don’t waste time digging through spreadsheets or logs. Platforms like Firebase, Mixpanel, and UXCam offer broad tracking capabilities.
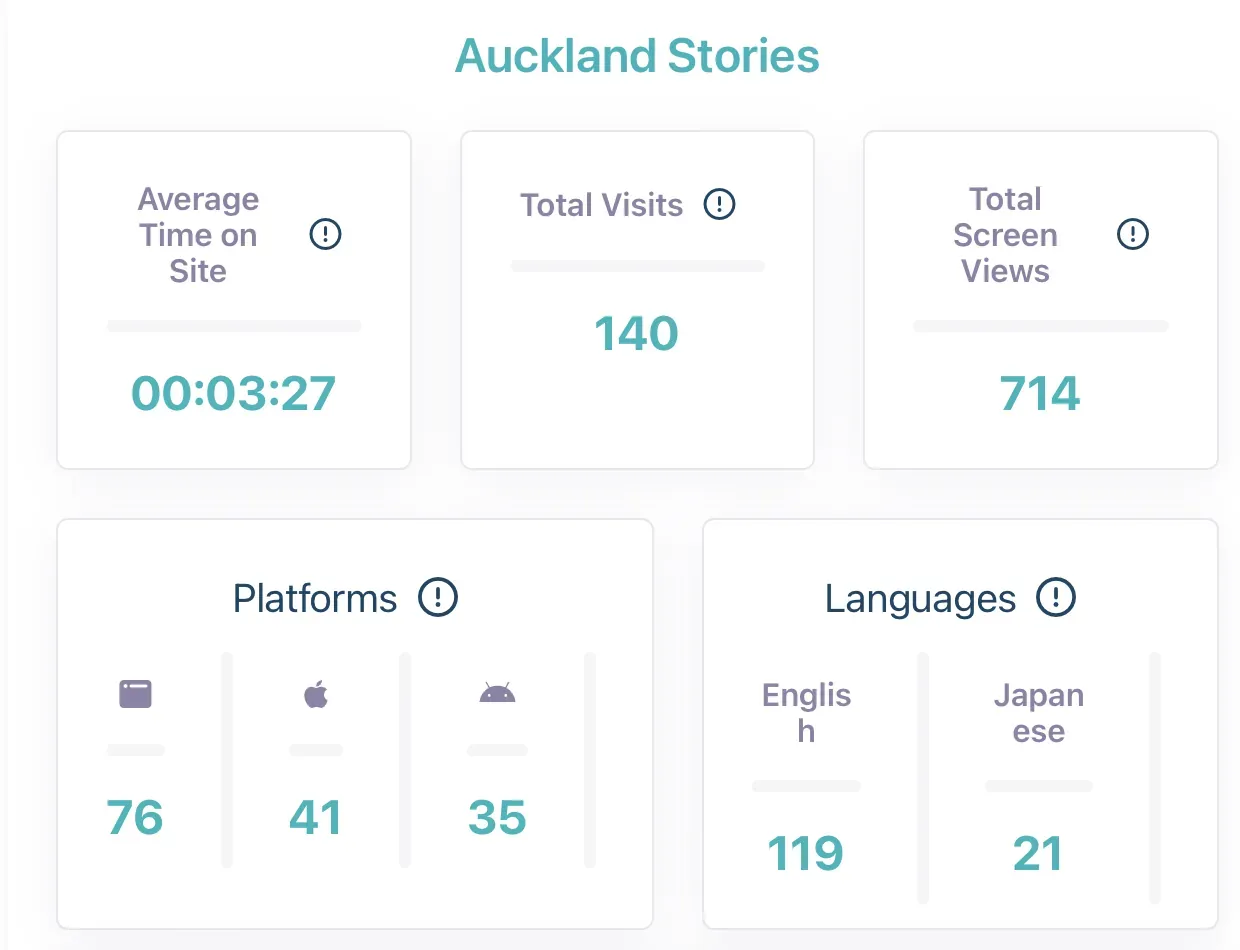
For destinations offering self-guided tour apps powered by STQRY, the STQRY Analytics Dashboard makes this effortless. It centralizes metrics like session counts, location-based engagement, and visitor interactions. This gives you a clear, easy-to-access overview of how your tours perform.
With intuitive visualizations and real-time insights, STQRY helps destinations track performance and optimize experiences without any technical hassle.
3. Don't Chase Too Many Metrics
Focusing on every available data point can create noise. Choose a few meaningful KPIs that align with your goals. This may include retention and session duration for engagement, or in-app purchases for monetization. Clarity beats quantity when it comes to data.
4. Never Ignore Context
Numbers only make sense when paired with context. A drop in session length might seem negative, but if your latest update streamlined navigation, users could simply be completing actions faster.
Always interpret changes within the bigger picture of product updates, marketing efforts, and seasonal trends.
5. Pay Attention to Anecdotal Evidence
Digital analytics are great, but they’re not the only way to measure success. If your goals are education or brand awareness, you might be more concerned with what visitors and customers are saying about your digital experience.
Pay attention to positive feedback about your app in the form of in-person comments, online reviews, and social media mentions.
6. Turn Insights Into Actions
Collecting metrics is only valuable if you use them to make meaningful improvements. Start by fixing technical issues, like slow load times or crashes, to keep the app running smoothly.
Then optimize engagement through better onboarding, notifications, and features that encourage repeat use. Monetization can be improved by testing pricing, subscriptions, or in-app offers based on user behavior.
Finally, combine these insights with user feedback to create a continuous loop of informed updates that drive growth.
FAQs
What is a KPI checklist?
A KPI checklist is a tool used to ensure you’re tracking the most important Key Performance Indicators for your business or project. It helps you identify which metrics matter, define how they will be measured, and ensure consistent monitoring to make informed decisions.
What are the 4 P's of KPI?
The 4 P’s of KPI are Purpose, Performance, People, and Process. They help organizations create useful KPIs by showing the metric’s purpose, how to measure it, who is responsible, and the steps needed to reach the target.
What is an example of a smart KPI goal?
A SMART KPI goal is Specific, Measurable, Achievable, Relevant, and Time-bound. For example: Increase monthly active users by 20% over the next 3 months through improved onboarding and push notifications.
How much is an app with 10,000 users worth?
The value of an app depends on user engagement, retention, and revenue per user. For example, if each user generates $5 per month, 10,000 users could bring in $50,000 monthly. The app’s total value also depends on growth potential, brand strength, and market demand.
Build a Branded Self-Guided Tour App and Measure Its Success with STQRY
Creating a branded self-guided tour app lets you deliver a unique, memorable experience for your visitors. With STQRY Apps, you can easily build, publish, and manage yourself-guided tour apps across iOS, Android, and web platforms without technical expertise.
Our no-code technology makes app creation simple, while excellent customer support ensures you have guidance every step of the way.
Moreover, the STQRY Analytics Dashboard makes it easy to track performance, engagement, and visitor behavior in real time. Combine these insights with user feedback to improve your tours and keep visitors coming back.
Ready to create immersive, data-driven tours with STQRY that engage visitors and drive results?